
Where do visitors find value in Hawai‘i?
Finding the Best Value Stays in Hawai'i
What 29,011 Hawai'i Airbnb listings reveal about where visitors actually find value against a hotel benchmark, island by island and neighborhood by neighborhood.
Tableau · Data Visualization · Team Case Study
Visitors choosing between an Airbnb and a hotel in Hawai’i are mostly guessing. A single statewide average hides the decision people are actually making, because prices swing hard between islands and again between neighborhoods on the same island.
My role
Data cleaning and preparation, the analysis, and the Tableau workbook and dashboard. A course project for BUAN 4220 Data Visualization at Seattle University, co-created with Jayden Respicio. I grew up on Oahu, so this is a question people genuinely ask me, which is why the test for every chart was whether it would change how someone books a trip.
What the data showed
About 70.33 percent of analyzed listings sat in neighborhoods whose average price exceeded the $250 benchmark. This is a geographic comparison of neighborhood averages, not a claim that any individual listing was more expensive than a matched hotel stay on the same dates. Source: 29,011 Inside Airbnb listings against a $250 per night benchmark drawn from broad Google estimates for three- and four-star hotels.
Within one island, the neighborhood changes the answer. On Oahu the spread runs from Ewa at $482.83 down to Central Oahu at $193.26, nearly $290 a night on the same island. Central Oahu is the clearest budget option in the state, and it is also the one area with essentially no hotels, which is the zoning footprint showing up in the data. Source: the same Inside Airbnb sample, averaged by neighborhood.
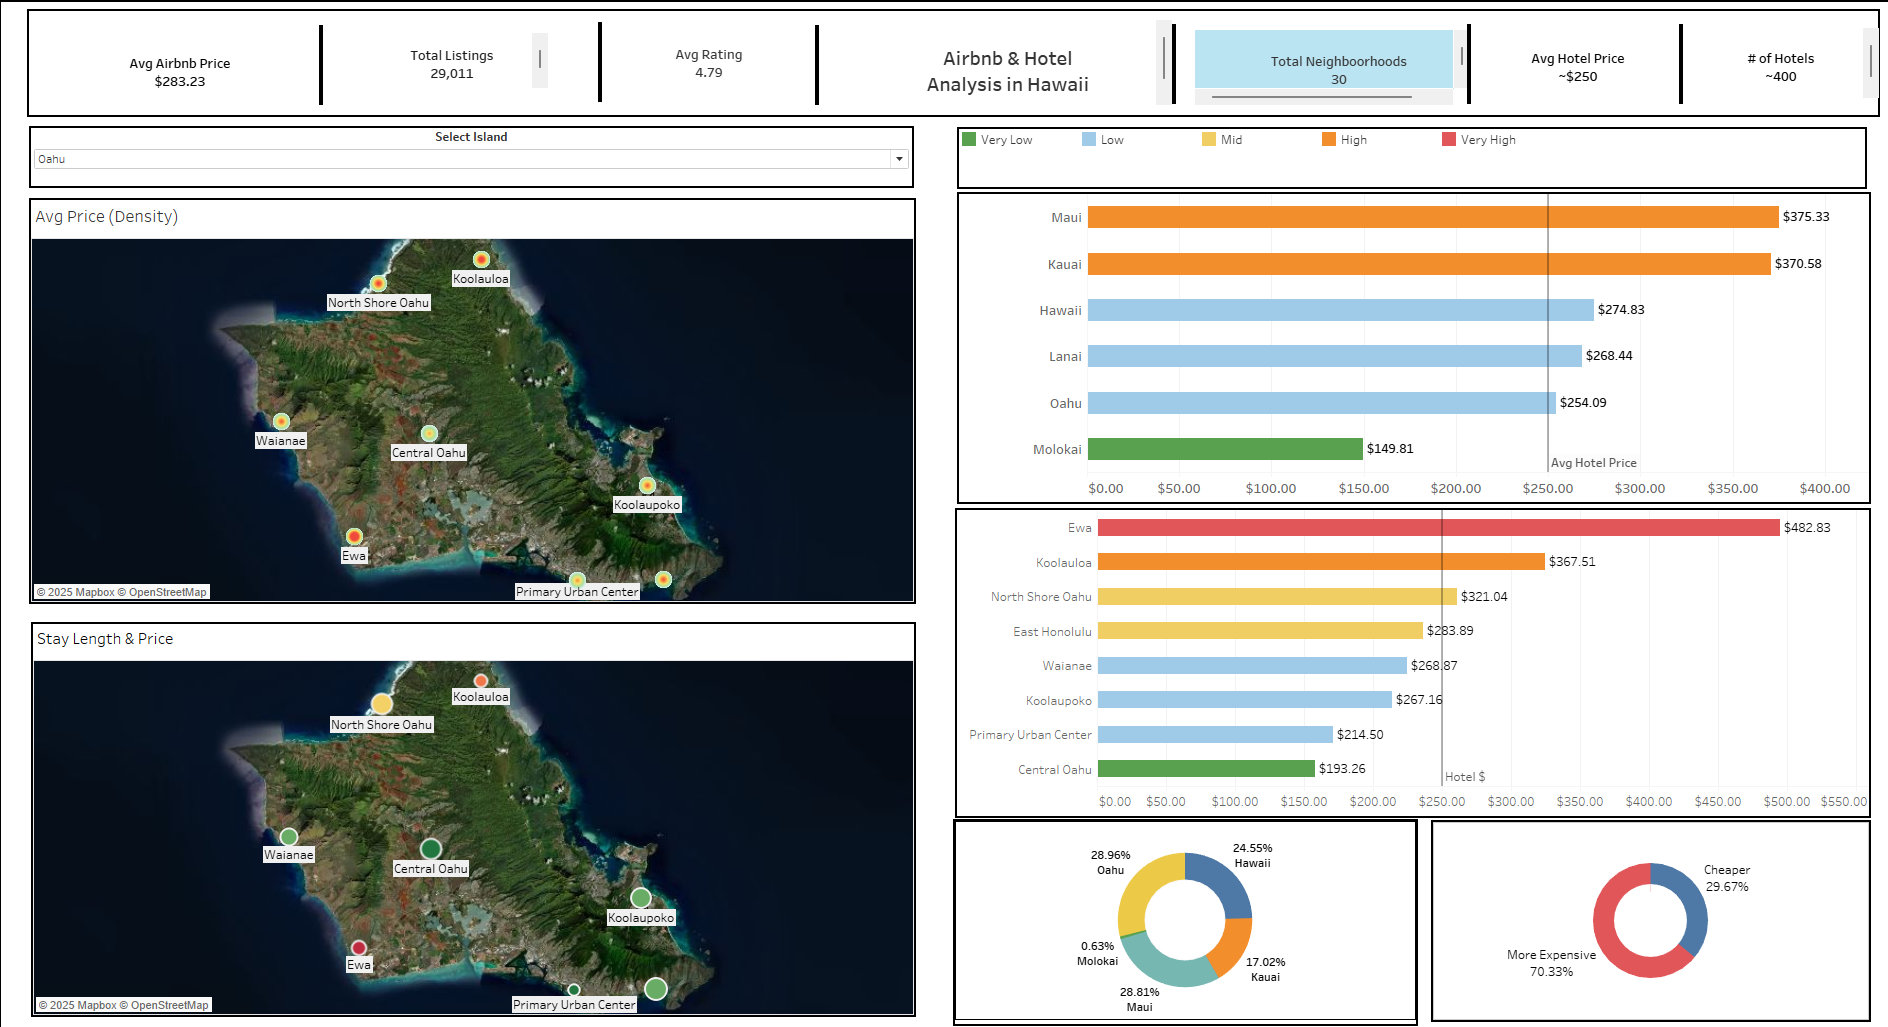
The dashboard with Oahu selected. The island selector drives both maps and the neighborhood ranking, so a reader can move from a statewide pattern to a local one without losing context.
More findings
- The statewide average hides the decision. The average listing came in at $283.23 against the $250 benchmark. High-price resort areas pull the mean up while a handful of neighborhoods sit well below it, and the two cancel out into a number that helps nobody.
- Island averages split into three tiers. Maui at $375.33 and Kaua’i at $370.58 sit far above the benchmark. Hawai’i at $274.83, Lāna’i at $268.44 and Oahu at $254.09 hover just over it. Moloka’i is the only island clearly below, at $149.81.
- On Kaua’i there is no budget neighborhood. Every displayed neighborhood averaged above the benchmark, led by Kōloa-Po’ipū at roughly $456. Where every neighborhood is coastal, proximity to water stops being a differentiator and becomes the floor.
- Supply concentrates where demand and zoning allow. Oahu holds 28.96 percent of listings and Maui 28.81, with Hawai’i at 24.55, Kaua’i at 17.02 and Moloka’i at 0.63. Quality is rarely the differentiator: the average rating across the sample is 4.79 out of 5.
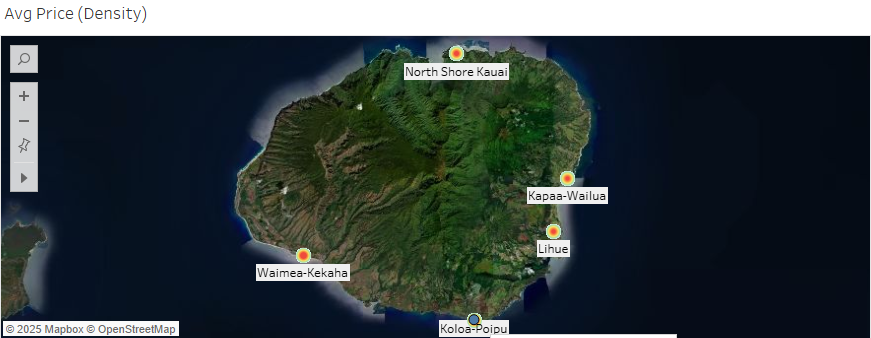
The same density view for Kaua’i, where every neighborhood marker sits above the benchmark.
What I recommended
For a standard short stay, price a hotel first, because most of the market says it wins. Airbnb earns its premium in specific cases: larger groups, longer stays, and neighborhoods hotels do not serve. Budget-focused visitors should look at Central Oahu and Moloka’i. Travelers set on Maui or Kaua’i should expect coastal pricing everywhere and plan around it rather than hunt for a bargain that is not there.
Method and limits
Started from 36,125 Inside Airbnb records, kept listings priced between $1 and $1,000, and excluded the separate “Hotel room” category, leaving 29,011 listings. Layered in Hawai’i’s short-term-rental zoning: rentals under 30 days are generally prohibited outside hotel and resort zones without a permit, which shapes where listings can legally exist. Built 14 Tableau worksheets and connected them into one dashboard with an island filter and cross-view actions. The packaged workbook includes the source data and calculates the Airbnb average dynamically.
The $250 figure works as a classroom benchmark and does not work as a matched comparison, because it was never matched by date, island, or neighborhood. Four things would have to change before this became booking advice:
- Match the comparison in time and place. Use hotel daily rates for the same travel dates and the same geographic areas as the Airbnb observations.
- Compare all-in stay cost. Add cleaning fees, service fees, taxes, parking, and the effect of minimum-night requirements instead of resting on base nightly price.
- Control for the travel party. Compare options at the same guest capacity, room count, property tier, and stay length.
- Document reproducibility. Publish the cleaned dataset, source dates, field definitions, and exclusion logic alongside the workbook.
What I took from the work
The useful discipline was refusing to let a single average stand in for a decision. A statewide mean of $283 against a $250 benchmark reads as a narrow loss for Airbnb; the neighborhood view shows a $290 spread inside one island, which is the number that would actually change a booking. The second discipline was writing down why the benchmark is weak. The honest version is more useful to anyone reading it.