Skip to content
Clark Hayashi

Business / Marketing Analyst · Measurement · Dashboards · AI Workflows

I turn messy data, ideas, and operations into clear decisions.

Business Analytics & Marketing graduate from Seattle University. Recent work: AI use-case prioritization at Bank of Hawaii, participation dashboards for Seattle U Recreation, and GA4/SEO lead tracking for a real estate business.

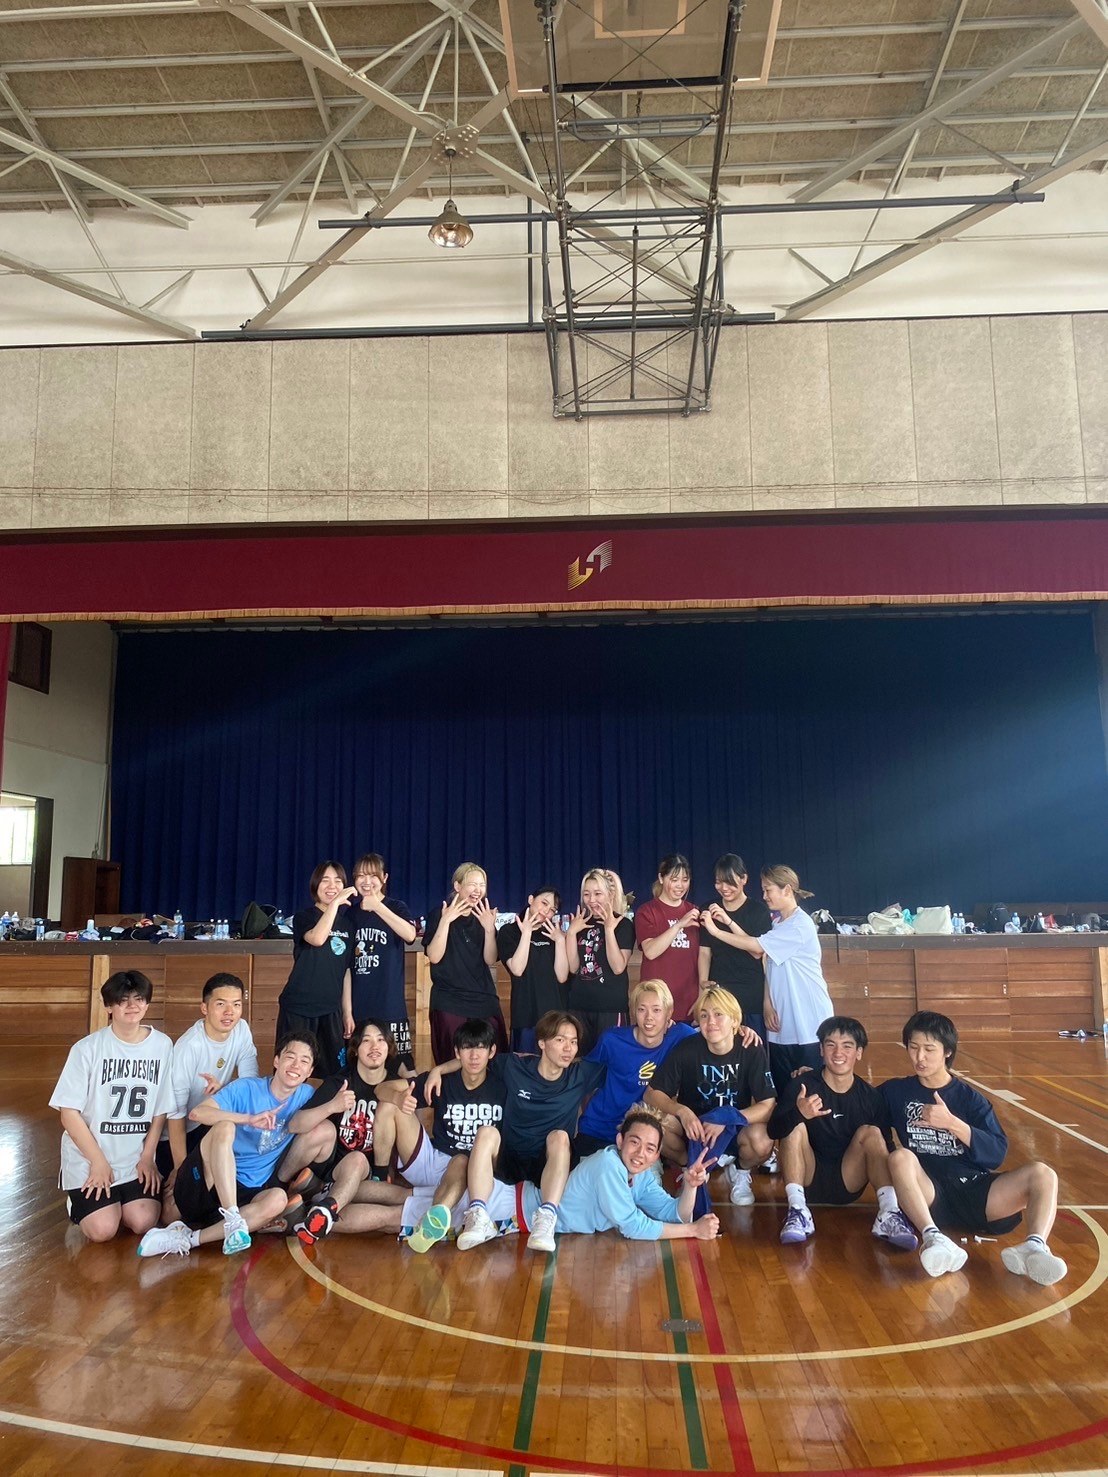
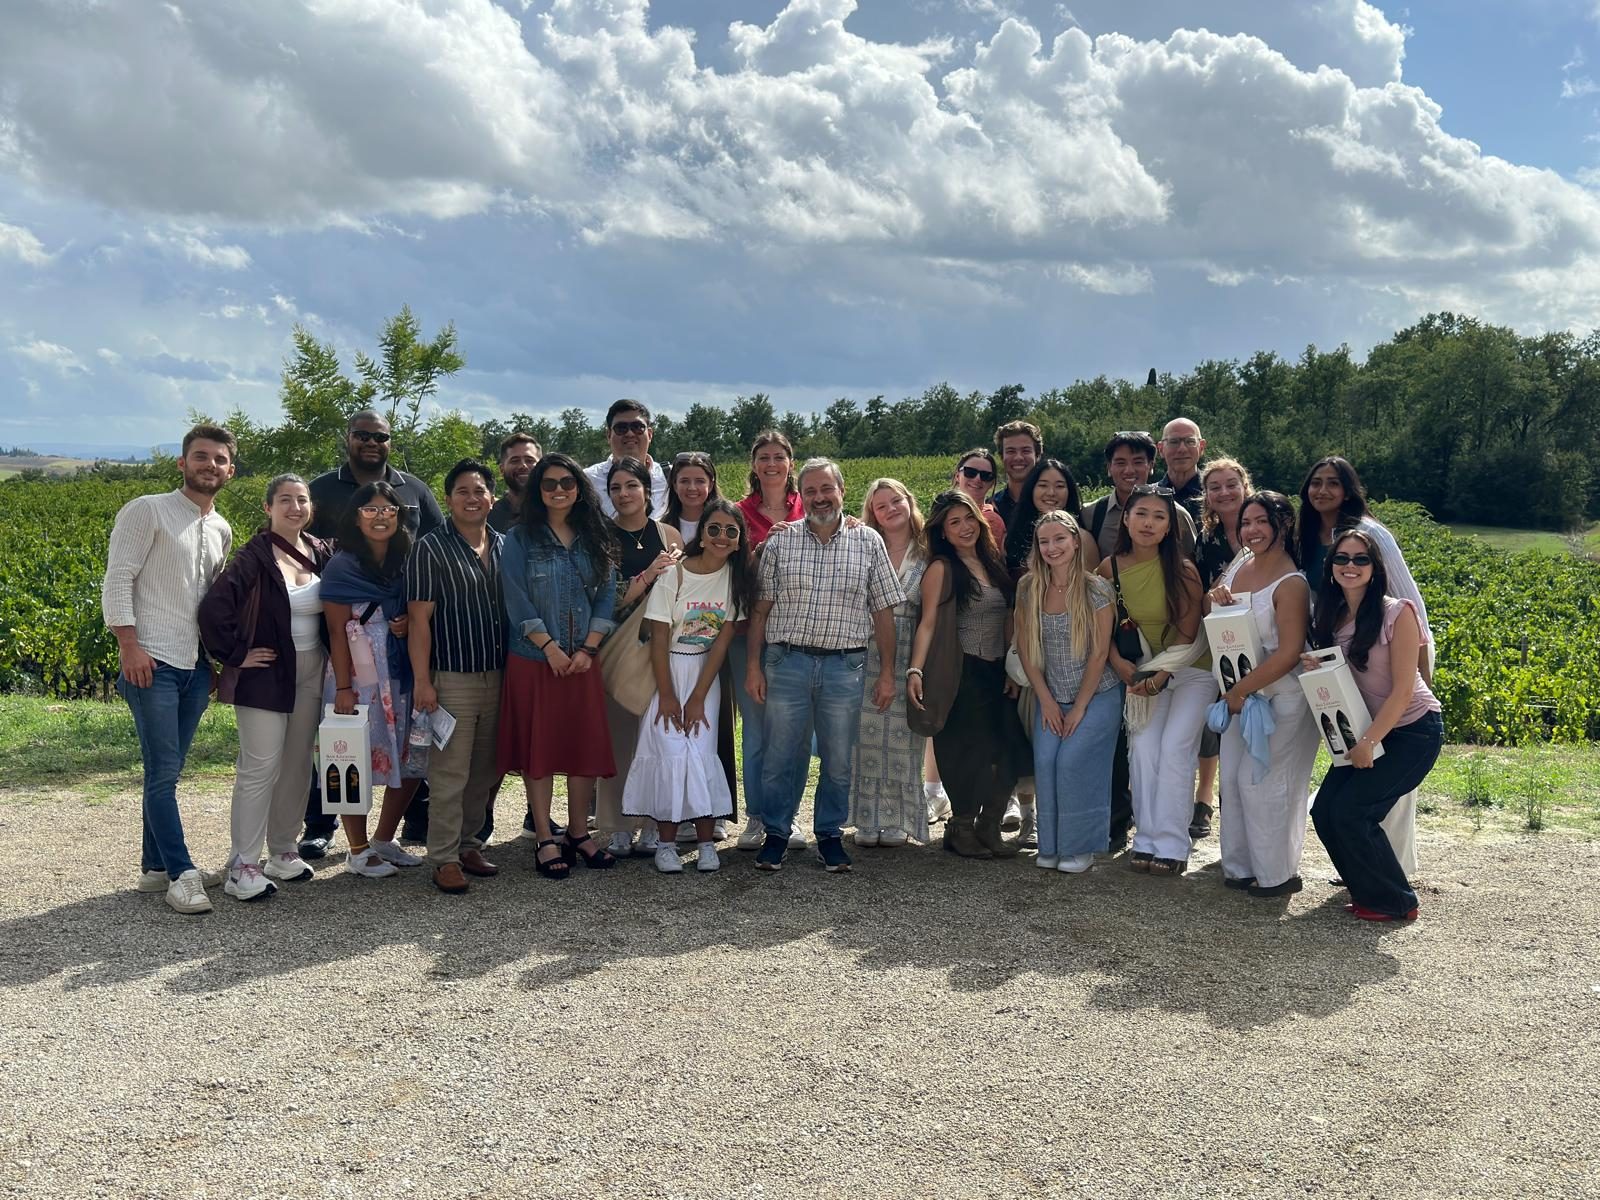
Rooted in Hawai‘i. Built in Seattle. Expanded through Tokyo and Italy.

Clark Hayashi

The Journey · Six Stops

Rooted in Hawai‘i. Built in Seattle. Stretched through Tokyo and Tuscany.

The work came out of these six stops, in this order. Step through the route, then follow it into the proof.

Click the globe, swipe, or use the arrow keys

Stop 01 · Honolulu

Where I'm from

2004 to 2022

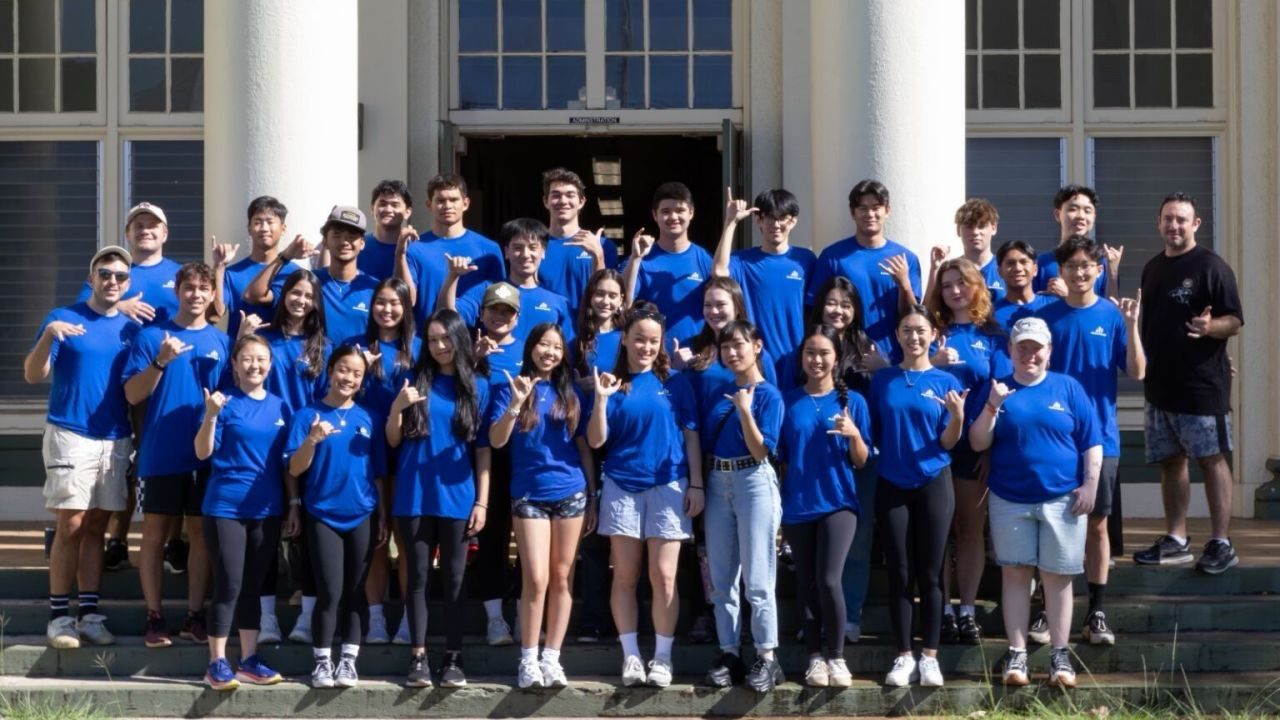
I grew up on O'ahu, where community isn't a value statement; it's how things get done. Punahou basketball and a varsity co-captain year, a 199-hour Eagle project rebuilding a library, and a first job ringing up military families at the Navy Exchange.

Sunset over the Hawai'i coastline

The Hawai'i years →

Selected Work

Completed work leads. Anything unfinished says so.

01

AI + Workflow Strategy

AI Use Case Prioritization

One of Bank of Hawaii's first AI interns. Gathered AI use cases across the organization and built the repository, scoring model, and Power BI dashboard used to prioritize them. Summarized publicly at a high level.

50+ use cases · 19+ stakeholder interviews · presented to 60+

AI Strategy · Power BI · Stakeholder Research

Completed · summarized
02

Operations Analytics

Intramural Sports Participation Analysis

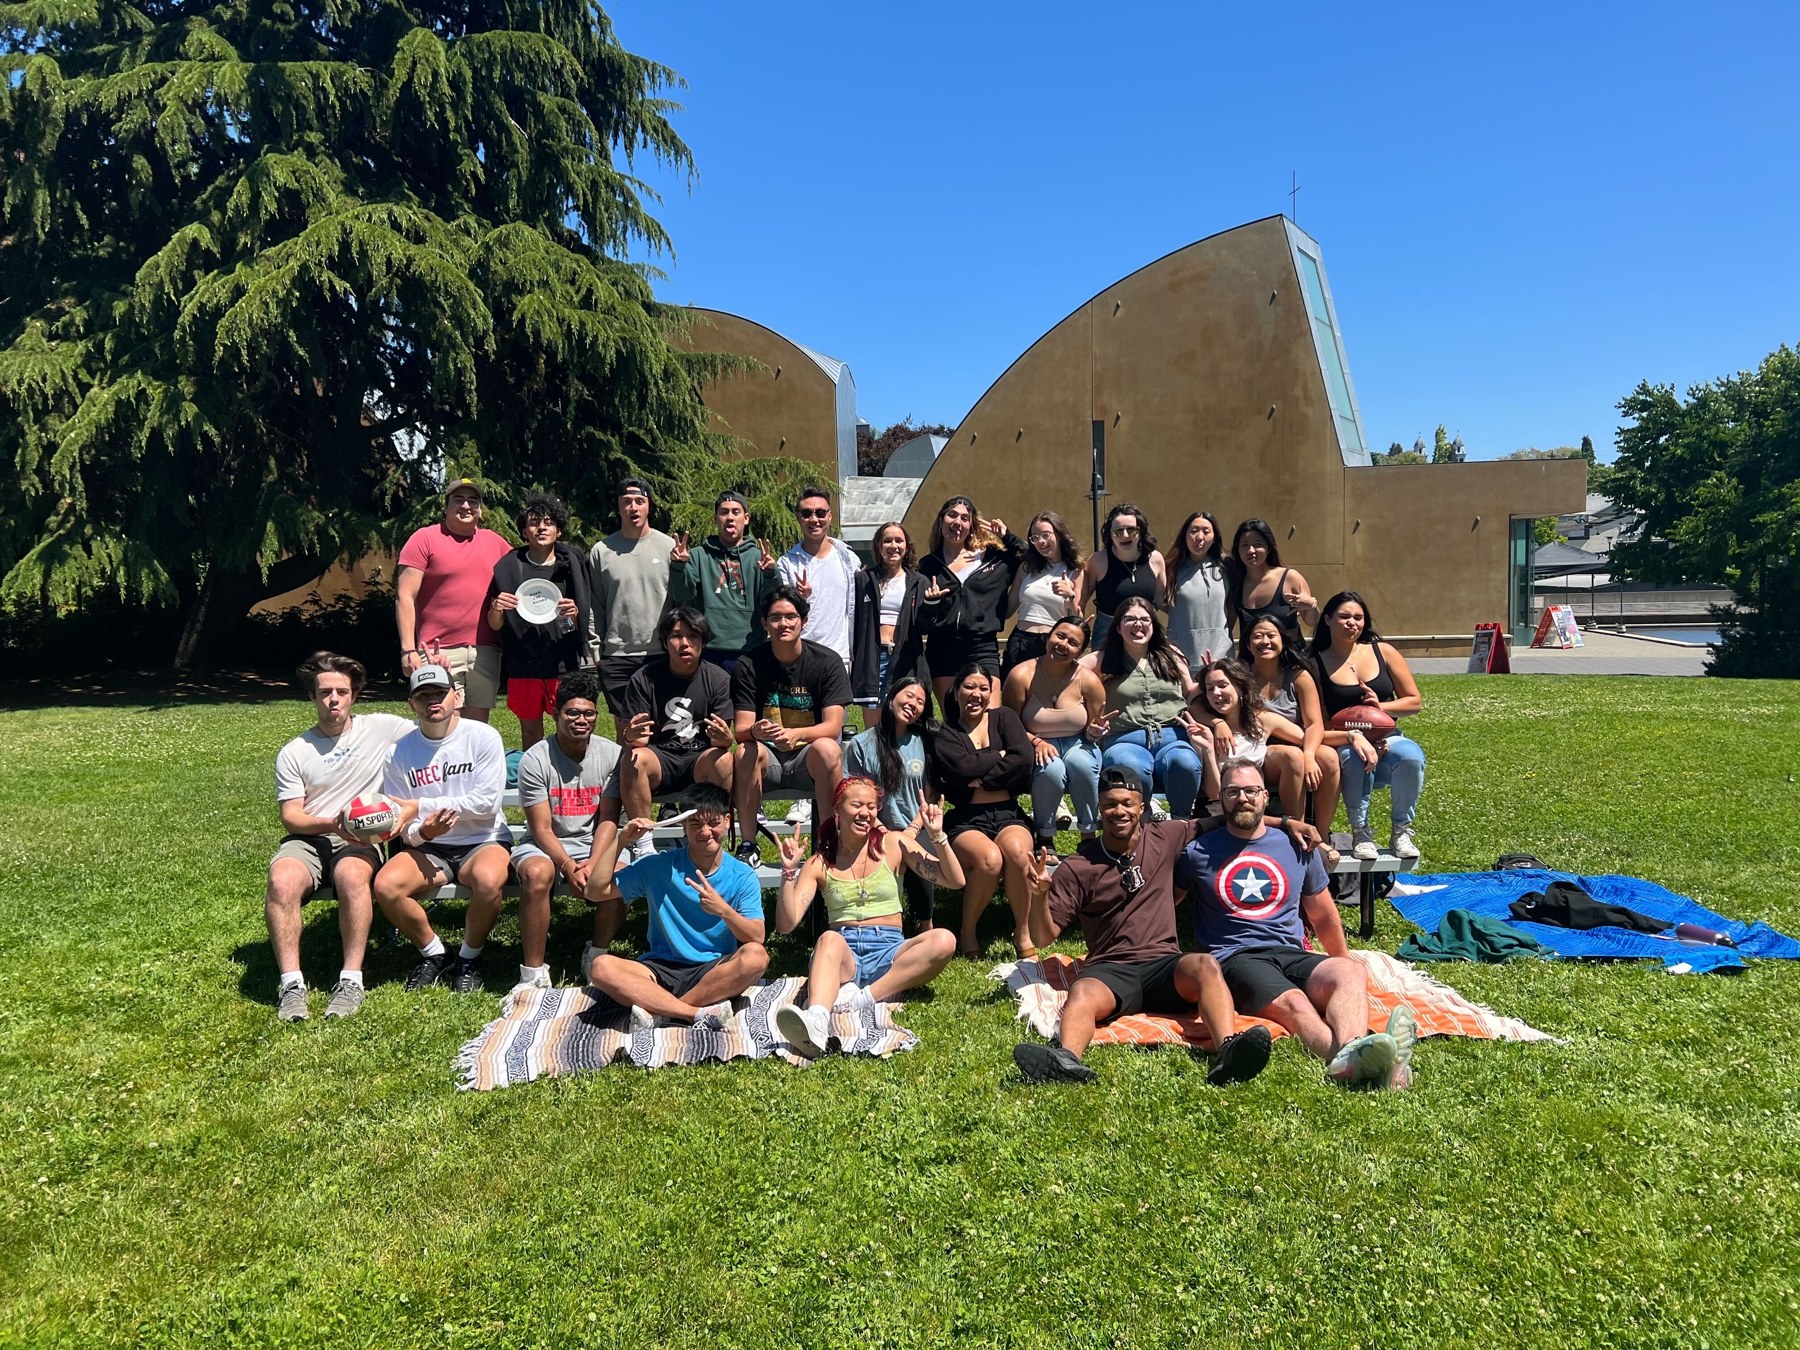
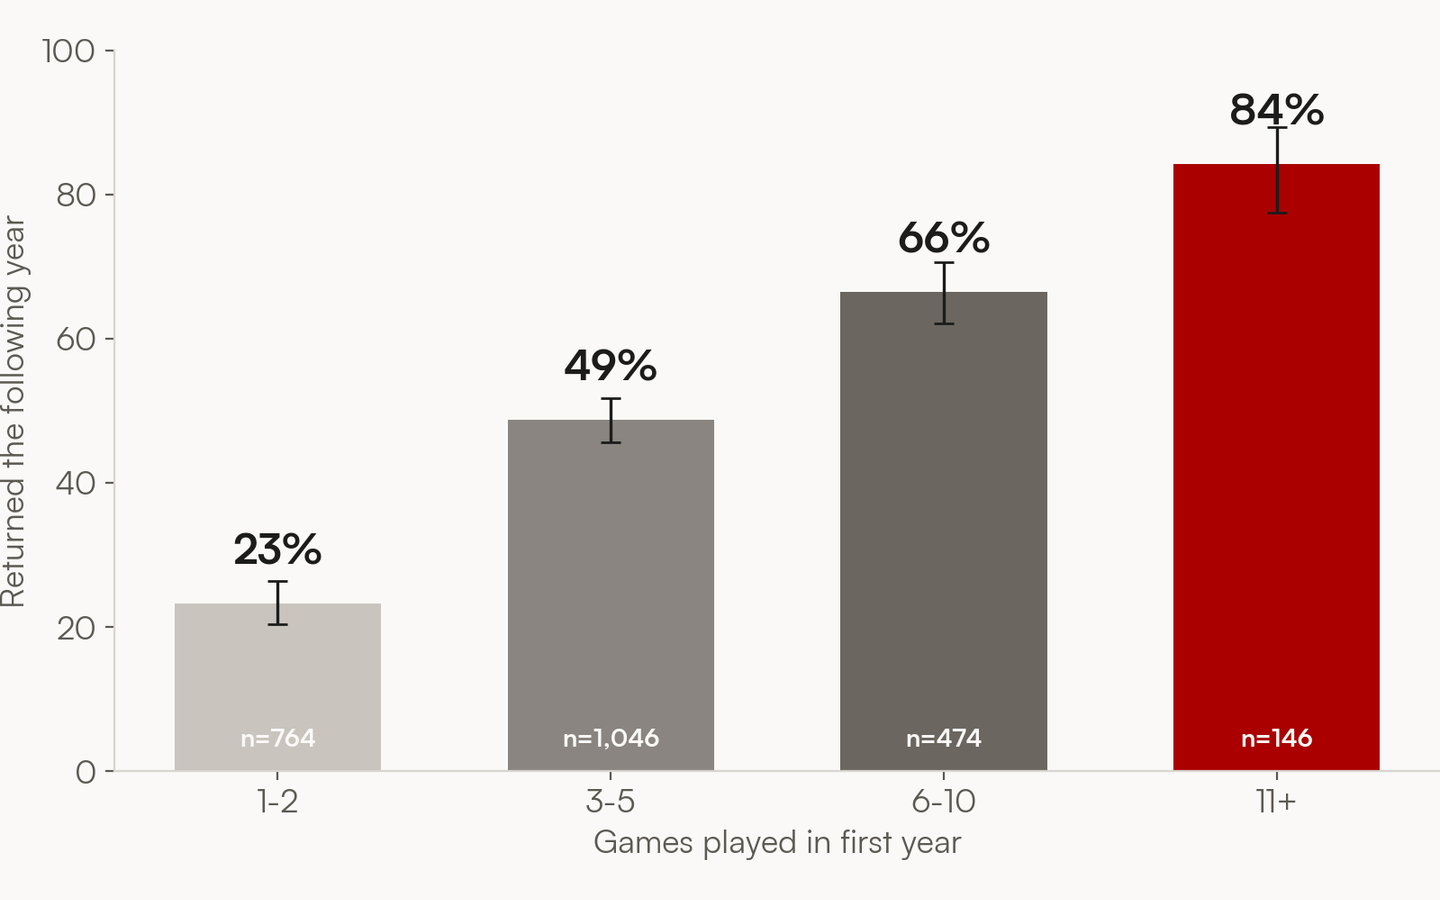
Seven years of participation data across a 469-participant, 64-team program, translated into dashboards UREC leadership used for scheduling, marketing, and retention planning.

7 years of data · 64+ teams · 469+ participants

Excel · Tableau · Stakeholder Reporting

Delivered · write-up in progress
03

Analytics + Data

Seattle Building Permit Analysis

Interactive Tableau dashboard on Seattle building permit data, built with an Applied Analytics SU team. Analyzed trends in construction activity and permitting, then presented findings to the club. Live on Tableau Public.

Team of 9 analysts · live, interactive dashboard

Tableau · Team Case Study · Public Data

Completed · view live
04

Analytics + Data

Finding the Best Value Stays in Hawai'i

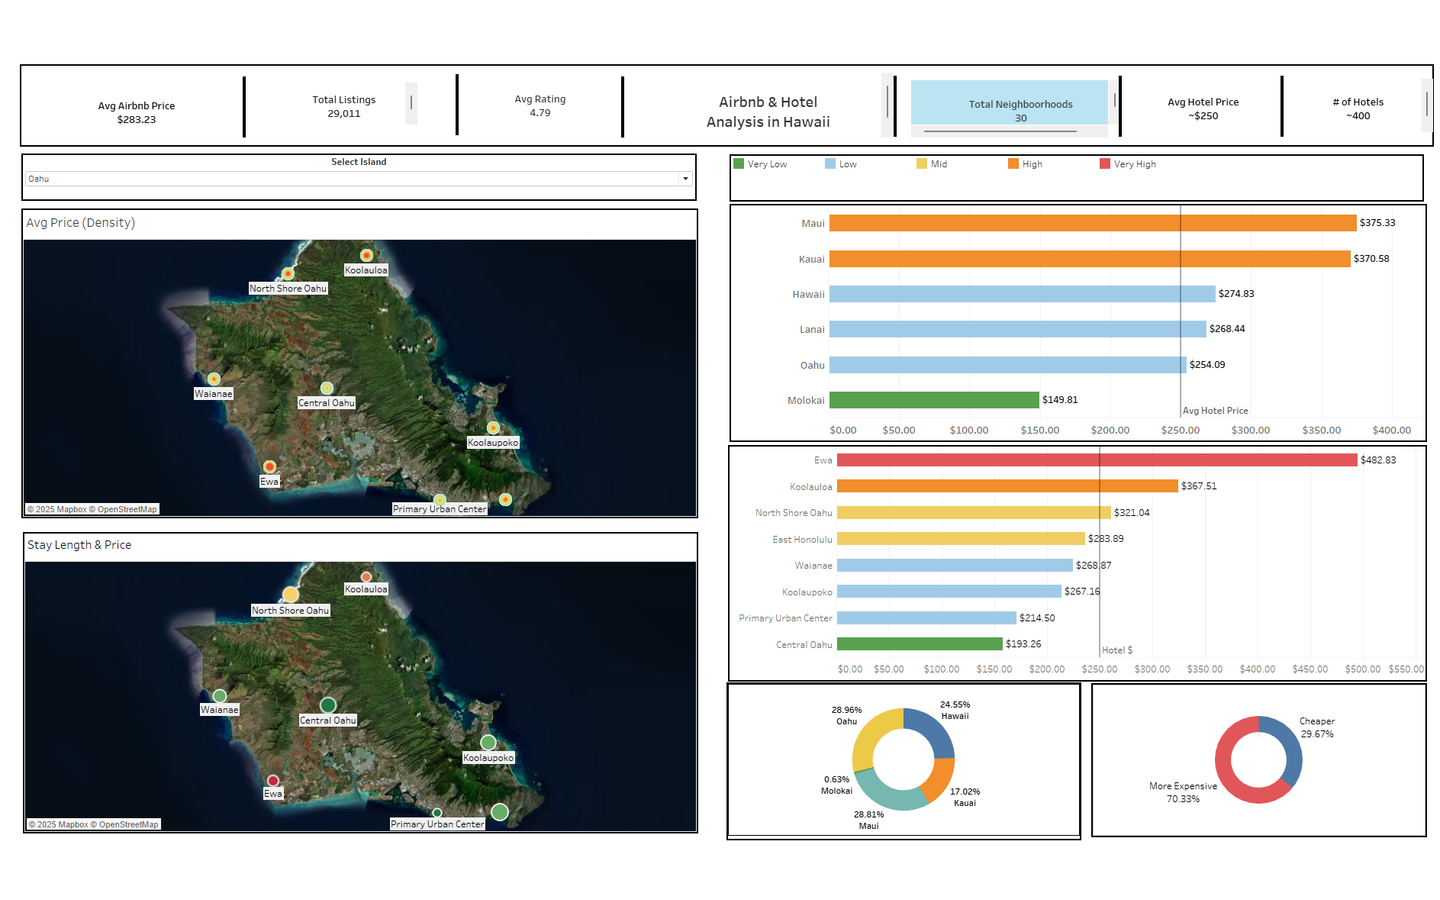
Airbnb vs. hotel value across the Hawaiian islands: ~36,000 Inside Airbnb listings, island and neighborhood pricing, ratings, and zoning context, built into an interactive Tableau dashboard.

~36,000 listings · interactive dashboard

Tableau · Data Visualization

Completed · artifacts publishing
05

Marketing + SEO

Real Estate Lead Analytics

GA4, Google Tag Manager, Search Console, UTM strategy, and local SEO reporting for a family real estate business. Results publish after a full month of clean data.

Full measurement stack, built from zero

GA4 · GTM · Search Console

Currently building
06

Analytics + Data

Tokyo Airbnb Pricing & Marketplace Analysis

Pricing distribution, submarket trends, and host recommendations from 25,000+ Tokyo Airbnb listings, analyzed in Python and visualized in Tableau.

25,000+ listings analyzed

Python · Tableau · Pricing Analytics

Case study · in progress
07

Visual Communication

The Journey Page

A scroll-driven atlas globe tracing Hawai'i to Seattle to Tokyo to Tuscany and home again. Orthographic projection, real coastlines, and great-circle route math written by hand in canvas.

0 libraries · hand-written projection math

Canvas · Scrollytelling · Vanilla JS

Live · interactive
08

Visual Communication

Clark's Reading Notes

A lightweight, searchable reading shelf for honest notes on books I finished, paused, or plan to revisit. Built as a portable static site with local assets and no third-party JavaScript.

11 books · search and status filters · 0 dependencies

Vanilla JavaScript · Information Design · Static Web

Live · personal project
09

Visual Communication

Portfolio Website

This site, designed and built with Astro, Tailwind, and AI-assisted workflows, from brand system to deployment. The proof for the visual communication lane is the thing you're reading.

Astro · Tailwind · AI Workflow

Live · this site

What I Bring

Five lanes, one job: make things clearer. The work above is the evidence.

Analytics + Data

I structure messy data into dashboards, reports, and recommendations a team can act on. Core tools: Excel, Tableau, Python; currently deepening SQL.

Marketing + SEO

Hands-on measurement work: GA4, Google Tag Manager, Search Console, UTM strategy, local SEO, and content performance. Currently applied to real estate lead tracking.

AI + Workflow Strategy

Enterprise AI use-case prioritization, scoring frameworks, and dashboards that translate AI ideas into business value people can actually evaluate.

Leadership + Operations

Proven across organizations, from Scouts BSA to UREC to SUCUI: I've run programs, trained 40+ officials, and built the schedules, reporting, and playbooks that help people execute better.

Visual Communication

I turn complex work into clear artifacts: dashboards, decks, short-form video, and case studies people actually understand. Tools: Photoshop, Premiere Pro, Final Cut Pro. This site included.

How I Work

01

Analyze

Start with the decision someone actually needs to make, then dig into the messy data, workflows, and business questions behind it. If the output doesn't change a decision, it isn't done.

02

Translate

Turn findings into clear stories: dashboards, decks, and recommendations in plain language. Data explains what's happening; talking to people explains why.

03

Build

Ship practical systems, reporting, and workflows teams actually use. A dashboard a team opens twice a week beats a perfect model nobody touches.

Before this, I was one of Bank of Hawaii's first AI interns and co-founded a student credit union initiative that won $22.5K across two business plan competitions. The thread through all of it: helping teams make sense of messy problems and turn ideas into action.

More about me →

Open to analyst roles across business, data, and marketing.

If your team needs someone who can take a messy problem and hand back a clear decision, let's talk.